Survey: Global demand for silver rose in 2014
Key components of global silver demand rose in 2014, with global silver jewelry demand posting a new record last year and silverware offtake rising to its highest level since 2006. This was coupled with notable growth in key silver industrial end uses, including ethylene oxide, photovoltaics, and brazing and alloys, according to World Silver Survey 2015, released by the Silver Institute. Gains in supply from mine production and producer hedging were partially offset by a continued decline in scrap supply.
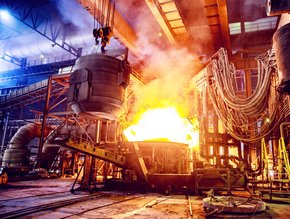
Silver fabrication demand
Total silver physical demand stood at 1.07 billion ounces last year, the fourth highest level recorded since 1990, but a 4 percent decline from the 2013 total. A main factor in the decrease in physical demand was a fall in coin and bar demand from 2013, which had been a record year.
The largest component of physical silver demand, industrial applications, which accounted for 56 percent of total physical silver demand, was marginally lower by 0.5 percent. On a regional basis, a modest increase in industrial demand in developing countries, led by 4 percent growth in China and Taiwan, was offset by weaker demand in advanced countries in 2014. This marks the fifth consecutive year of Chinese industrial demand growth. Last year’s industrial demand total for Taiwan was 23 percent above their 2009 figure.
• Related content: INFOGRAPHIC: Who Controls the World's Supply of Silver
Silver demand for photovoltaic applications rose 7 percent in 2014 while silver demand for ethylene oxide (EO) grew 6 percent. On the latter, GFMS estimates that 128.6 million ounces (Moz) of silver resided in EO plants around the word at year-end, equivalent to 15 percent of last year’s total mine production. Additionally, brazing alloy and soldering demand increased by 3 Moz in 2014. Photography demand slid by 5 percent in 2014, experiencing its slowest pace of decline since 1999.
Globally, silver jewelry fabrication had a second consecutive year of growth, increasing 1.5 percent to achieve a new record.
This was a reflection of high levels of restocking and a strong performance from India, which surged 47 percent from 2013 levels. Gains were also noted in Europe, up 9.3 percent, and North America, up 2.2 percent. Total silverware fabrication rose 3 percent to levels not seen since 2006, primarily due to a 20 percent increase in demand from the Indian Subcontinent.
World Silver Supply and Demand (million ounces)
(totals may not add due to rounding)

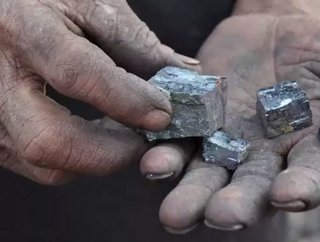
Silver investment and price
In 2014, silver coin and bar purchases remained at historically high levels, primarily due to growth in silver coin demand in several key markets. Growth was experienced in the United States, Canada, India and Spain. Silver coins and medals demand was 107.6 Moz last year.
Holdings by silver-backed exchange traded funds remained sturdy, growing by 1.4 Moz, to record their highest year-end level at 636 Moz. In contrast, gold ETF holdings ended 2014 at 53.1 Moz, 8.8 percent lower than their year-end 2013.
• Related content: [INFOGRAPHIC] How-To: Test for Counterfeit Gold and Silver
Identifiable investment demand, which includes physical bar investment, coins and medals and exchange traded funds (ETF) inventories, stood at 197.4 Moz last year. Demand for physical bullion bars reached 88.4 Moz. India experienced a 4 percent growth in silver bar demand last year, but that was countered by losses in the United States, China and Europe when compared to the prior year.
A combination of a slowdown in Chinese growth, a move away from commodities as an asset class, a stronger U.S. dollar, and a challenging year for most precious metals in general, led to a lower average annual silver price at $19.08 for 2014.
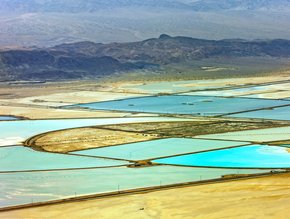
Silver supply
Silver mine production grew by 5.0 percent to reach 877.5 Moz. This growth is attributable to stronger output from the primary silver and copper sectors, new projects that came online last year and significant production gains in Central and South America. Primary silver mine production grew 8 percent, and accounted for 31 percent of global silver mine supply. Mexico was the world’s leading silver producer, followed by Peru, China, Australia and Chile. Primary silver mine cash costs dropped 16 percent to US$7.74 an ounce, while the producer silver hedge book grew by 15.8 Moz in 2014.
Government sales of silver were essentially nonexistent last year. Scrap supply was down 13 percent at 168.8 Moz, the lowest volume level recorded since 1996 and the third consecutive year of decline. As a proportion of total silver supply, scrap remained just above 15 percent, down from 25 percent in 2011 and 2012.
Stay connected! Follow us on Twitter and like us on Facebook
- Brightstar, Eldridge and Claure acquire AusencoSupply Chain & Operations
- First Quantum contracts with MECS to cut emissionsSupply Chain & Operations
- Tin production at Andrada Mining reaches record levelsSupply Chain & Operations
- Ternium plans to build US$3.2bn steel plant in MexicoSupply Chain & Operations